
CATRINE Deliverable D8.1 introduces new metrics and a prototype scorecard to help scientists identify transport errors more clearly and improve atmospheric carbon monitoring.
The CATRINE project has published Deliverable D8.1, setting out new tracer transport metrics for evaluating the global atmospheric transport models used in carbon monitoring. Led by ECMWF and CEA, with contributions from project partners, the report shows how well different models reproduce observed atmospheric CO2 patterns from the near-surface to the upper troposphere and lower stratosphere. Figure 1 shows the observational network behind the analysis.
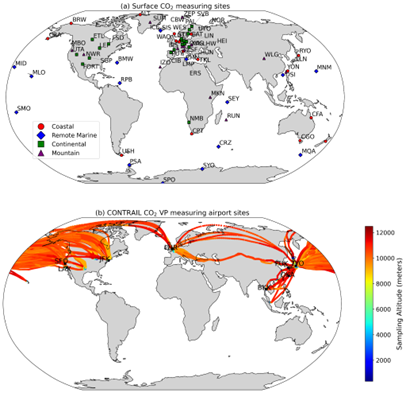
Figure 1. Global distribution of surface monitoring sites (https://gml.noaa.gov/ccgg/obspack/) and CONTRAIL aircraft (https://www.cger.nies.go.jp/contrail/) sampling locations used to evaluate atmospheric CO2 transport in the CATRINE study.
The study evaluates four global simulations within the CATRINE TransCom intercomparison, using common prescribed surface fluxes and comparing model output with both near-surface measurements and aircraft observations. Some simulations perform consistently well across latitude bands and terrain types. But all models show a systematic underestimation of CO2 in the upper troposphere and lower stratosphere which have a large inter-model spread during boreal summer. These findings point to a key priority: improving transport representation in these layers to reduce uncertainty in atmospheric inversion systems.
A major outcome of the deliverable is a prototype scorecard that combines the most relevant metrics for assessing large-scale three-dimensional tracer transport biases. Tested with IFS simulations of CO2 and SF6, the scorecard helps pinpoint where and when systematic biases are strongest across regions, vertical layers and seasons. As Figure 2 shows, it offers a practical way to compare model performance of different regions, vertical layers and total column and their associated large-scale spatial gradients. An annual global scorecard allows to compare the model performance across seasons for different model resolutions, as shown in Figure 3.
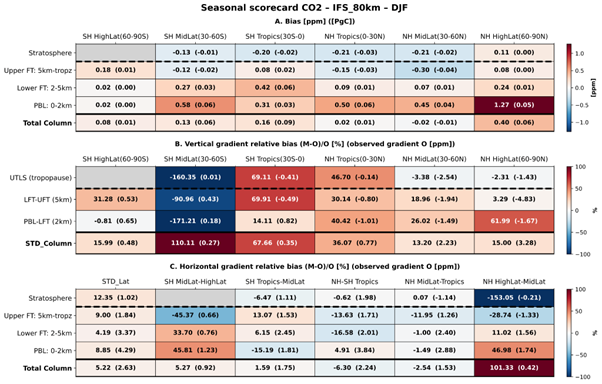
Figure 2. Prototype seasonal scorecard for CO2 showing how transport biases can be assessed across regions, vertical layers and total column for each season in a single integrated framework. The reference for the scorecard prototype is based on ATom observations (https://espo.nasa.gov/atom).
The findings are directly relevant to the continued development of the Copernicus CO2 Monitoring and Verification Support capacity and the Copernicus Atmosphere Monitoring Service. By giving scientists clearer diagnostics of vertical and horizontal transport errors, the new metrics and scorecards can support model development, strengthen quality control and improve confidence in estimates of greenhouse gas emissions and sinks.
The report also calls for wider observational coverage, particularly in the upper troposphere and lower stratosphere, and for further development of the scorecard using additional tracers and higher-resolution simulations. Figure 3 highlights how increasing model resolution can improve performance in some areas while exposing new biases in others. In the next phase of the project, the team will investigate transport errors using TransCom simulations of SF6 and radon tracers and assess the impact of even higher model resolution.
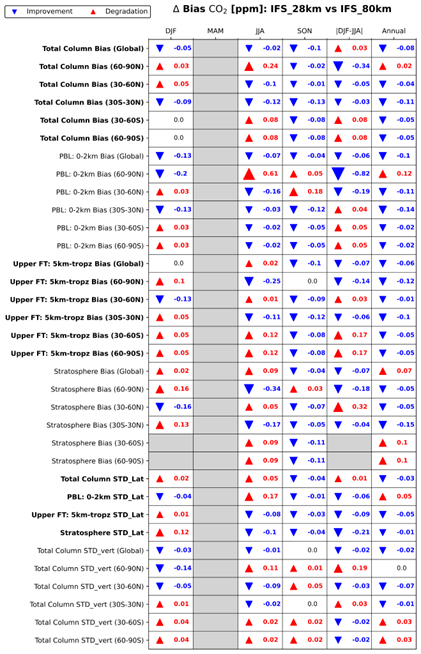
Figure 3. Assessment of how increasing IFS model resolution from 80 km to 28 km affects atmospheric CO2 transport model performance, highlighting areas of improvement and degradation.
Article created by R.Phipps (ECMWF) using Copilot to summarise CATRINE Deliverable D8.1. To ensure accuracy it was reviewed by A. Agusti- Panareda (ECMWF) and F. Chevalier (CEA)
Images taken from CATRINE Deliverable D8.1.